
Table of Contents
- 1. DashGo – Dashboard Conversion Leads Presentation
- 2. SocioReport - Social Media, Website Dashboard Presentation Report
- 3. Brandalytics TikTok Analytics Report Template
- 4. DashCom - Social Media, Website, Ecommerce & Insight Report
- 5. Socializee - Social Media Analytics Report Presentation
- Conclusion
Creating an effective KPI dashboard is essential for any business looking to track performance and make data-driven decisions. PowerPoint is a versatile tool that can help you present your KPIs in a visually appealing and easily digestible format. To make your job easier, we’ve curated a list of the top five PowerPoint templates specifically designed for KPI dashboards. These templates will not only save you time but also enhance the professionalism of your presentations.
1. DashGo – Dashboard Conversion Leads Presentation

DashGo – Dashboard Conversion Leads Presentation is an excellent template for businesses focused on conversion metrics. This template features a clean and modern design, making it easy to present your lead conversion data effectively. With various slide layouts, you can showcase your KPIs, trends, and insights in a visually engaging manner.
Key Features:
-
Modern design with customizable elements
-
Multiple slide layouts for different data presentations
-
Easy integration of charts and graphs
2. SocioReport - Social Media, Website Dashboard Presentation Report
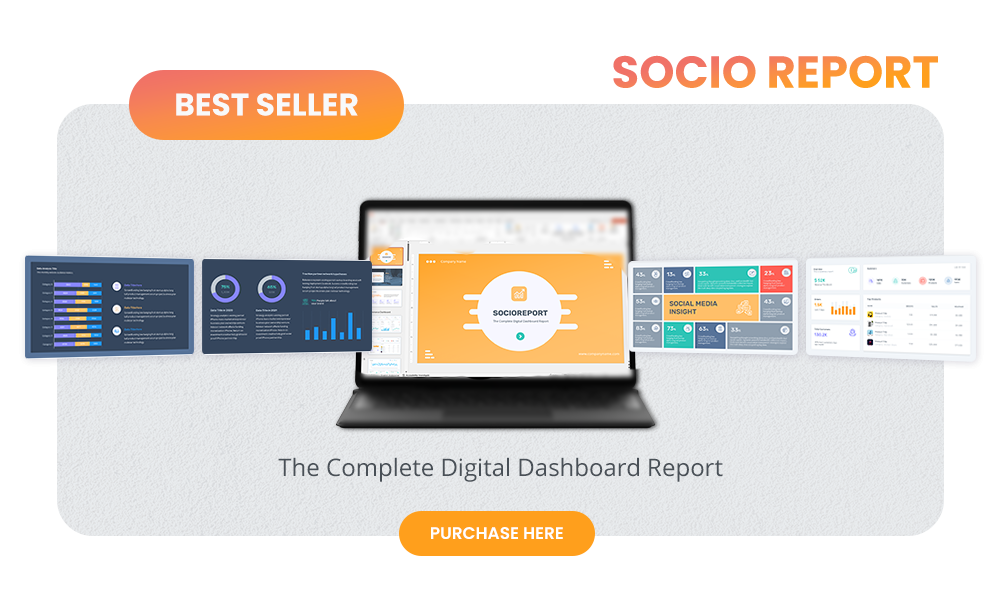
For businesses that rely heavily on social media and web analytics, SocioReport - Social Media, Website Dashboard Presentation Report is a perfect choice. This template allows you to present social media metrics alongside website performance data, providing a comprehensive view of your online presence.
Key Features:
-
Focus on social media and website analytics
-
Visually appealing charts and graphs
-
User-friendly design for easy customization
3. Brandalytics TikTok Analytics Report Template
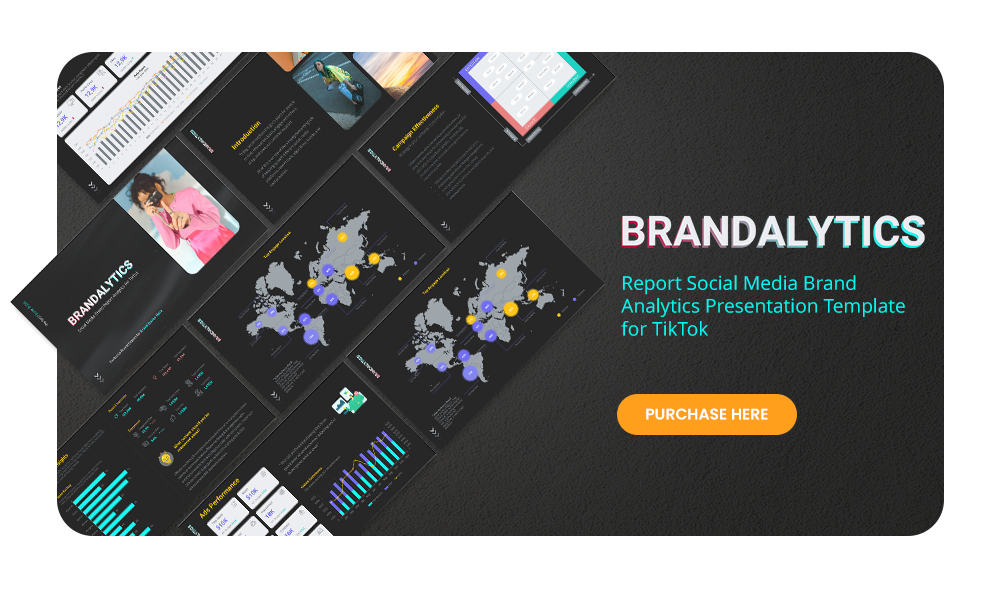
With the rise of TikTok as a marketing platform, Brandalytics TikTok Analytics Report Template is a must-have for brands looking to track their performance on this platform. This template is specifically designed to present TikTok metrics, making it easier to analyze engagement, reach, and conversion rates.
Key Features:
-
Tailored for TikTok analytics
-
Engaging visuals to represent data
-
Easy to edit and adapt to your brand’s style
Also Read : 5 Eye Catching Pitch Deck Templates to Impress Investors in 2025
4. DashCom - Social Media, Website, Ecommerce & Insight Report
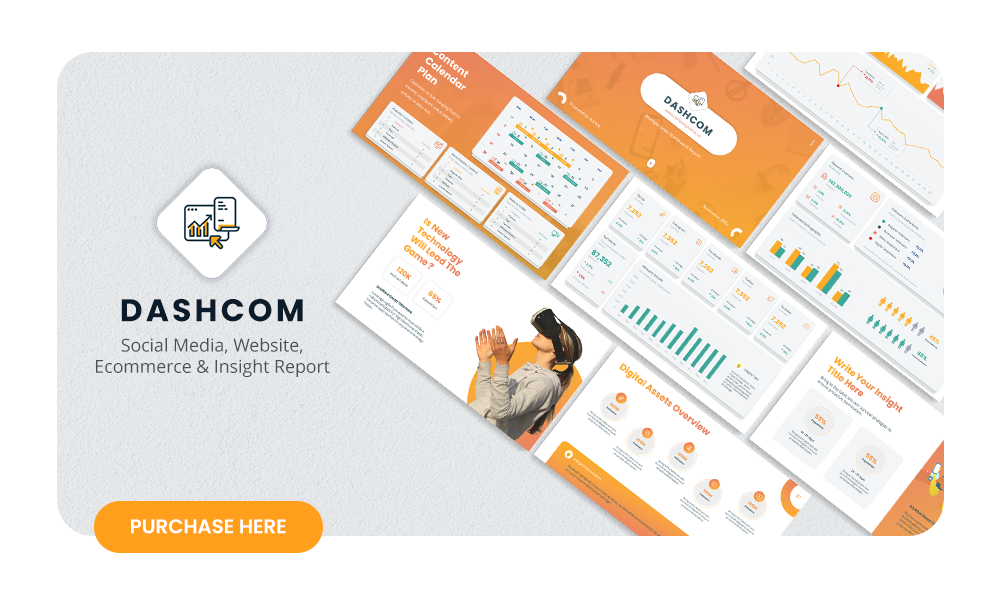
The DashCom - Social Media, Website, Ecommerce & Insight Report template is a versatile option for businesses that operate across multiple channels. This template allows you to present insights from social media, website traffic, and eCommerce performance all in one place, making it ideal for comprehensive reporting.
Key Features:
-
Multi-channel analytics presentation
-
Customizable slides for various KPIs
-
Professional design that enhances data storytelling
5. Socializee - Social Media Analytics Report Presentation
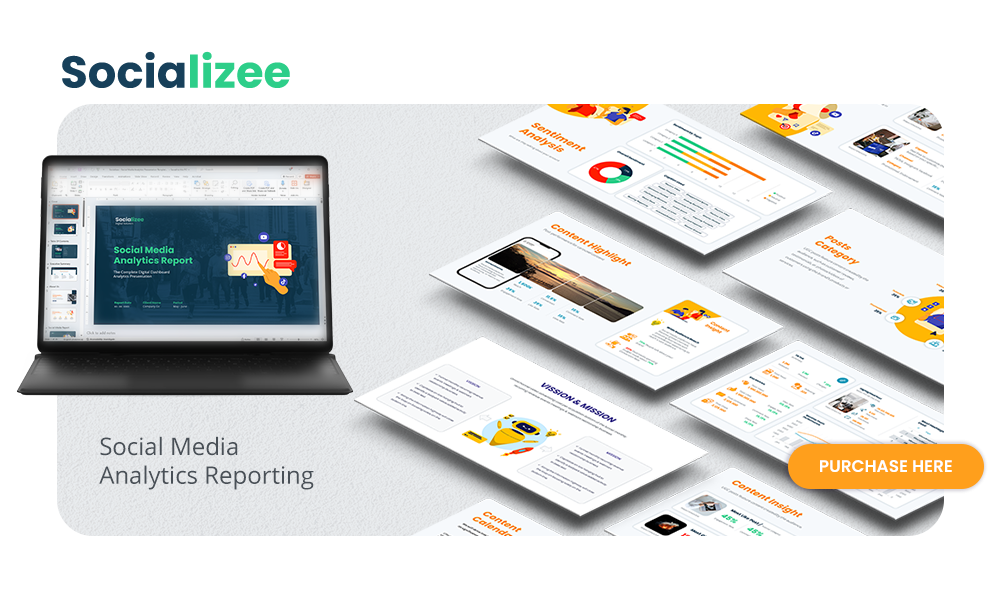
Finally, the Socializee - Social Media Analytics Report Presentation template is perfect for businesses that want to focus solely on social media performance. This template provides a range of slides to showcase different social media metrics, helping you to communicate your social media strategy effectively.
Key Features:
-
Focused on social media analytics
-
Visually engaging and easy to customize
-
Ideal for presenting to stakeholders and teams
Conclusion
Choosing the right PowerPoint template for your KPI dashboard can significantly impact how your data is perceived. The templates listed above offer a variety of features tailored to different business needs, ensuring that you can present your KPIs in a clear and engaging manner. Whether you’re focusing on social media, website performance, or conversion metrics, these templates will help you create impactful presentations that drive results.
Explore these templates and elevate your KPI reporting today!