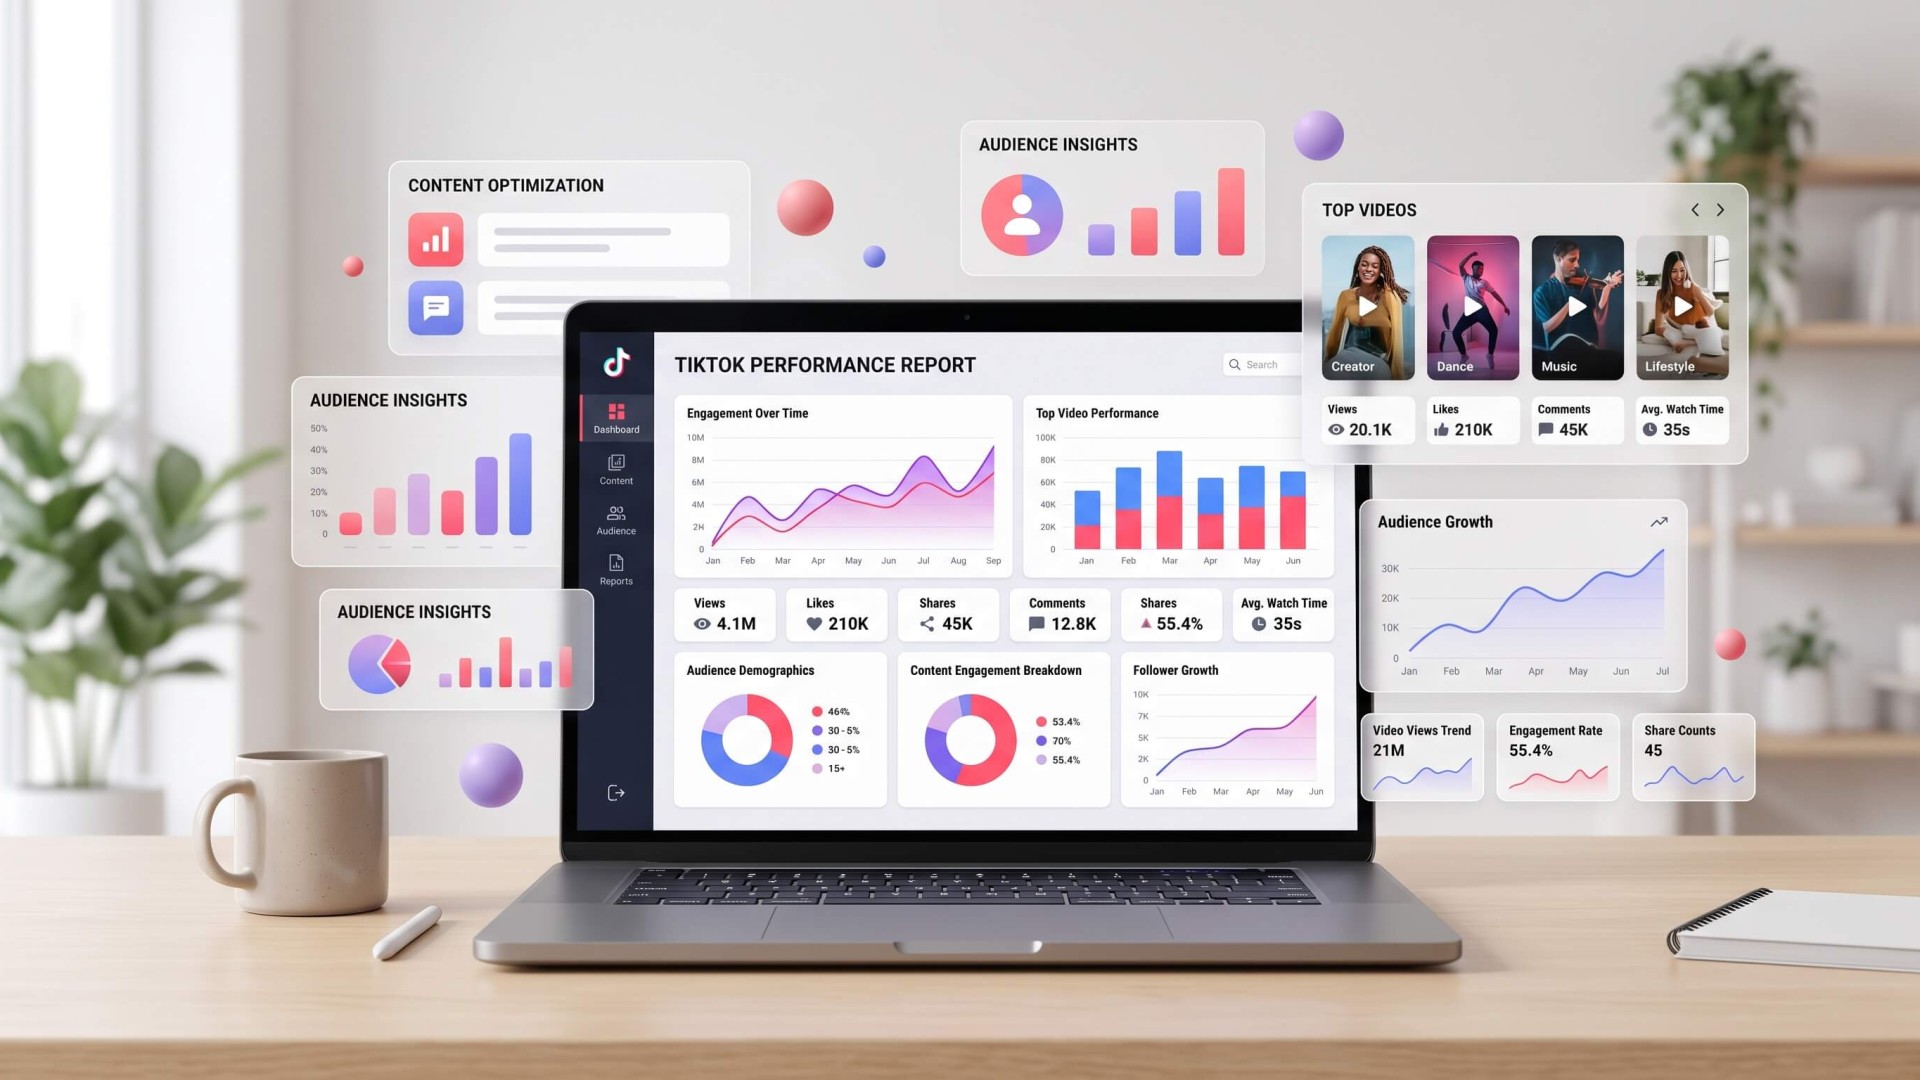
A TikTok performance report turns your account data into a clear picture of what is working, what is changing, and where your content strategy needs improvement. Instead of looking at individual TikTok analytics numbers, a well-structured report connects metrics such as views, engagement, followers, and content performance to the goals of your social media strategy.
Whether you are reporting on your own TikTok account, managing social media for a brand, or preparing a client report, the right TikTok report template can make the process faster and easier to understand.
In this guide, you will learn how to build a TikTok performance report, which metrics to include, how to organize the data, and how to turn TikTok analytics into useful insights.
What Is a TikTok Performance Report?
A TikTok performance report is a document that summarizes how a TikTok account and its content performed during a specific period.
It typically combines account-level metrics, video performance, audience information, engagement data, and key observations. The goal is not simply to show how many views a TikTok account received, but to explain what those numbers mean.
A useful report should help answer questions such as:
- How much did the TikTok account grow?
- Which videos generated the most views?
- Which content received the strongest engagement?
- How did engagement change compared with the previous period?
- Which content formats or topics performed well?
- What should be tested or improved in the next reporting period?
This makes a TikTok performance report more useful than simply exporting a collection of analytics screenshots.
Why You Need a Structured TikTok Report
TikTok can generate a large amount of performance data. Without a consistent reporting structure, it can be difficult to identify meaningful patterns.
A structured report creates a common framework for reviewing performance from one period to another. It also makes it easier for marketers, social media managers, and clients to understand the results without having to navigate TikTok analytics themselves.
A good report should make three things clear:
- What happened? Show the relevant performance data.
- Why did it happen? Identify patterns and possible reasons behind the results.
- What should happen next? Translate the findings into actionable recommendations.
1. Define the Reporting Period
Before collecting data, define the period covered by the report. For example, you might create a weekly, monthly, or quarterly TikTok performance report.
Monthly reporting is often useful for brands because it provides enough data to identify content patterns while keeping the reporting process manageable.
Whatever period you choose, use the same reporting period consistently. If possible, compare the current period with the previous period to show whether important metrics increased, decreased, or remained relatively stable.
Your report should clearly state the reporting period near the beginning, such as:
- September 1–30, 2026
- Previous period: August 1–31, 2026
2. Start With an Executive Summary
The first section of a TikTok performance report should provide a quick overview of the most important results.
Instead of forcing the reader to go through every chart, summarize the major changes in a few points.
For example:
- Total video views increased compared with the previous month.
- Follower growth accelerated after several educational videos were published.
- One short-form video generated significantly higher reach than the account average.
- Engagement was strongest on videos that used a specific problem-and-solution format.
The executive summary should focus on observations rather than simply repeating every number in the report.
3. Include the Most Important TikTok Analytics
The next step is to identify the core TikTok analytics that represent account performance.
The exact metrics you need will depend on your goals, but a typical TikTok performance report can include:
| KPI | What It Shows | Why It Matters |
|---|---|---|
| Video Views | Total views generated by videos | Shows content reach and exposure |
| Profile Views | Visits to the TikTok profile | Indicates interest beyond individual videos |
| Followers | Audience size and growth | Helps measure long-term audience development |
| Likes | Total likes received | Provides a basic signal of audience response |
| Comments | Audience comments generated | Helps indicate conversation and interaction |
| Shares | Times content was shared | Useful for understanding content that audiences want to distribute |
| Average Watch Time | Average time viewers spend watching content | Helps evaluate viewer retention |
You do not necessarily need every available metric. Select KPIs that are directly connected to the purpose of the account and the goals of the campaign.
4. Measure Follower Growth
Follower growth is one of the easiest metrics to understand, but it should not be viewed in isolation.
Include the starting follower count, ending follower count, and net growth for the reporting period.
For example:
- Starting followers: 25,400
- Ending followers: 27,150
- Net growth: +1,750
You can also visualize follower growth with a simple line chart. This makes it easier to identify periods where audience growth accelerated or slowed down.
More importantly, connect follower growth with content activity. If follower growth increased during a period when several videos performed particularly well, those videos may provide useful clues about what attracts new followers.
5. Analyze Content Performance
Content performance should be one of the most important sections of your TikTok report.
Rather than looking only at the account totals, create a table showing how individual videos performed.
| Video | Views | Likes | Comments | Shares | Engagement |
|---|---|---|---|---|---|
| Video A | 125K | 8.2K | 410 | 920 | Strong |
| Video B | 72K | 4.6K | 185 | 510 | Good |
| Video C | 18K | 1.1K | 62 | 74 | Average |
This section helps you identify your top-performing content and compare it against the average performance of the account.
6. Identify Your Top-Performing Videos
A TikTok performance report should highlight the videos that generated the strongest results.
You can rank videos based on different criteria, depending on your objective.
- Most views: useful for identifying high-reach content.
- Highest engagement: useful for identifying content that generated interaction.
- Most shares: useful for finding highly distributable content.
- Highest watch time: useful for understanding content retention.
- Most profile visits: useful when the goal is to drive users toward the account.
Do not automatically assume that the video with the most views is the most valuable piece of content. A video with fewer views but stronger engagement or profile activity may provide a different strategic insight.
7. Review Engagement Performance
Engagement helps show how audiences respond after seeing your content.
Depending on the available data and reporting objective, engagement analysis can include likes, comments, shares, and other relevant interactions.
One simple way to summarize engagement is to calculate an engagement rate based on the metric you are using as the denominator.
For example, if you use views as the denominator:
Engagement Rate = (Likes + Comments + Shares) ÷ Views × 100
The important part is to use the same calculation consistently when comparing periods or videos. Different platforms and reporting tools may define engagement rate differently, so always document the formula used in your report.
8. Analyze Audience Insights
TikTok analytics can also provide useful information about the audience behind the content performance.
Depending on the data available for the account, audience analysis may include:
- Audience demographics
- Top audience locations
- Audience activity patterns
- Follower growth
- Audience interests or relevant audience signals
Audience insights become more useful when they are connected to content performance.
For example, if a particular content topic performs strongly and the audience data shows that it resonates with the account's primary target market, that finding can influence future content planning.
9. Compare Content Categories or Formats
If the account publishes different types of content, group videos into meaningful categories.
For example, a brand might classify its videos as:
- Educational content
- Product demonstrations
- Entertainment
- Behind-the-scenes content
- Customer stories
- Promotional content
You can then compare the average performance of each category.
This approach can reveal patterns that are difficult to see when looking at individual videos alone.
10. Look for Patterns Behind the Numbers
This is where a TikTok report becomes more than a collection of metrics.
After reviewing the data, look for recurring patterns in your best-performing content.
Consider questions such as:
- Do shorter videos consistently generate stronger completion or watch-time signals?
- Which topics generate the most comments?
- Which content receives the most shares?
- Do educational videos outperform promotional videos?
- Are certain hooks associated with higher view counts?
- Which publishing periods correlate with stronger results?
Avoid claiming that a particular factor caused the result unless you have enough evidence to support the conclusion. Instead, describe recurring patterns as observations and use them to formulate experiments for the next reporting period.
11. Turn TikTok Analytics Into Insights
Numbers alone do not explain what a marketer should do next. Your report should translate important observations into concise insights.
For example, instead of writing:
“Video views increased by 42%.”
You could provide additional context:
“Video views increased by 42%, primarily driven by several educational videos that generated above-average reach.”
The second version gives the reader a clearer direction for further analysis.
A useful insight typically connects three elements:
- Observation: What changed?
- Context: What content or activity is associated with the change?
- Action: What should be tested or reviewed next?
12. Add Recommendations for the Next Period
Finish the report with a short list of recommended next steps.
Recommendations should be based on the observations in the report rather than generic social media advice.
For example:
- Produce more videos around topics that consistently generated strong engagement.
- Test different hooks while keeping the core topic consistent.
- Review videos with high views but relatively low engagement.
- Experiment with formats associated with stronger watch-time performance.
- Replicate successful content structures without simply reposting the same concept.
Keep the recommendations specific enough that the content team can turn them into actual experiments.
What Should a TikTok Report Template Include?
If you are building a reusable TikTok report template, consider organizing it into the following sections:
- Reporting period
- Executive summary
- Account overview
- Follower growth
- Reach and video views
- Engagement performance
- Top-performing videos
- Content analysis
- Audience insights
- Key findings
- Recommendations
- Next-period goals
This structure gives you a repeatable framework that can be adapted for monthly client reporting, internal marketing reviews, or campaign reporting.
How to Make a TikTok Report Easier to Read
A report does not need to contain every available data point. In fact, too much information can make important findings harder to identify.
Use visual hierarchy to separate the most important information from supporting details.
A practical layout might use:
- KPI cards for the most important account metrics.
- Line charts for follower or performance trends.
- Bar charts for comparing content categories.
- Tables for individual video performance.
- Callout sections for important insights.
- Recommendation sections for next steps.
The reader should be able to understand the main performance story within a few minutes before diving into the detailed data.
Use a TikTok Analytics Report Template
Building a TikTok report from scratch every month can take unnecessary time, especially when you need to prepare reports for multiple accounts or clients.
A pre-designed reporting template gives you a consistent structure for presenting TikTok analytics while allowing you to replace the data, charts, screenshots, and insights for each reporting period.
If you need a ready-made reporting layout, check out the Appiqa report templates for presentation-based reporting designs.
For a more specific TikTok-focused option, the Brandalytics TikTok Analytics Report Template can be used as a starting point for organizing TikTok performance data into a structured report.
Final Thoughts
A useful TikTok performance report should do more than present a list of numbers. It should show how the account performed, identify the content that contributed to the results, explain important patterns, and provide clear ideas for what to test next.
Start with the KPIs that matter to your objectives, organize the data into a consistent structure, highlight meaningful content performance, and finish with actionable observations.
With a reusable TikTok report template, the reporting process becomes easier to repeat while keeping your TikTok analytics presentation clear and consistent from one reporting period to the next.