About the product
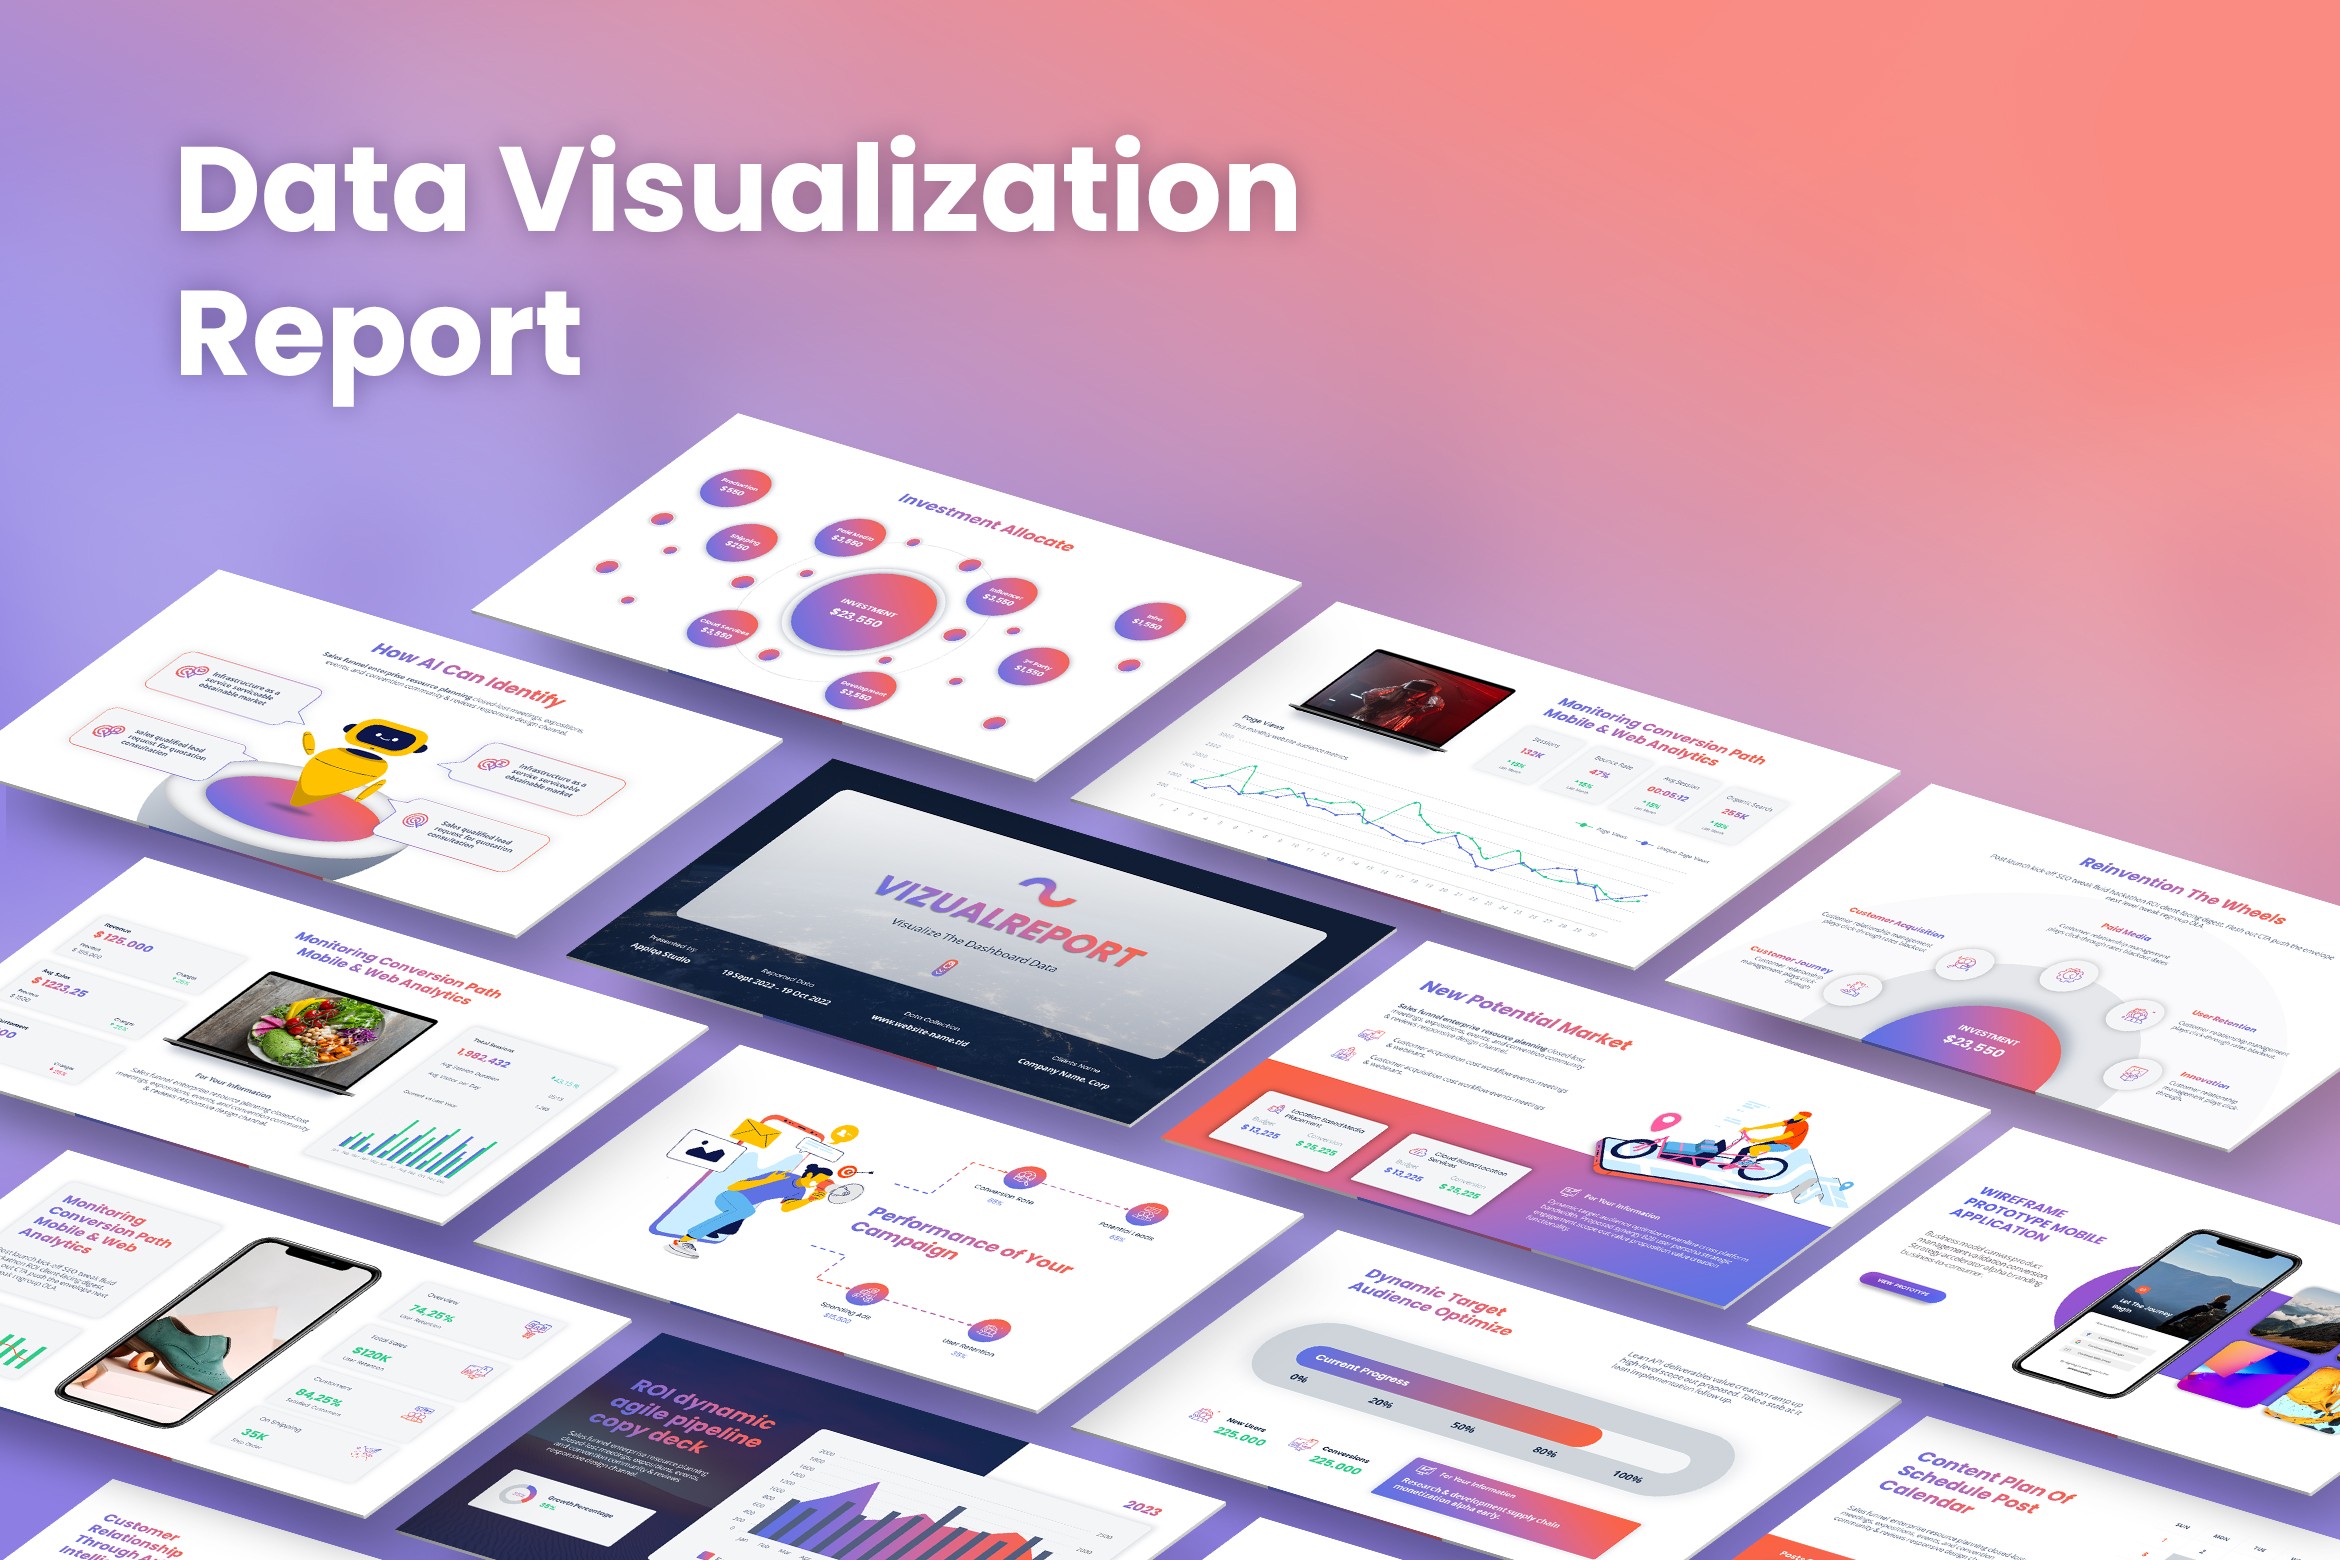
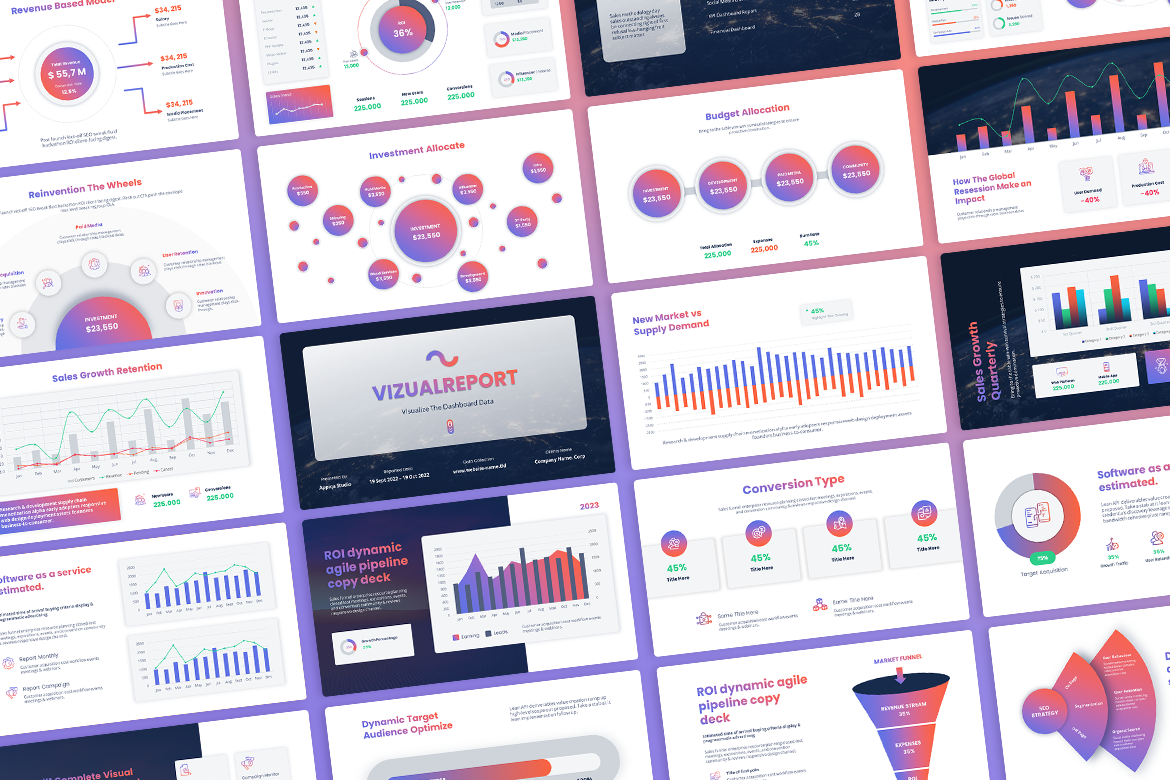
Empower your data insights with VizualReport, the ultimate data visualization report presentation template. Designed for analysts, data scientists, and professionals seeking to convey complex information effectively, VizualReport enables you to transform intricate data into actionable insights, making your presentations captivating and informative.
Features :
- 38 Slides
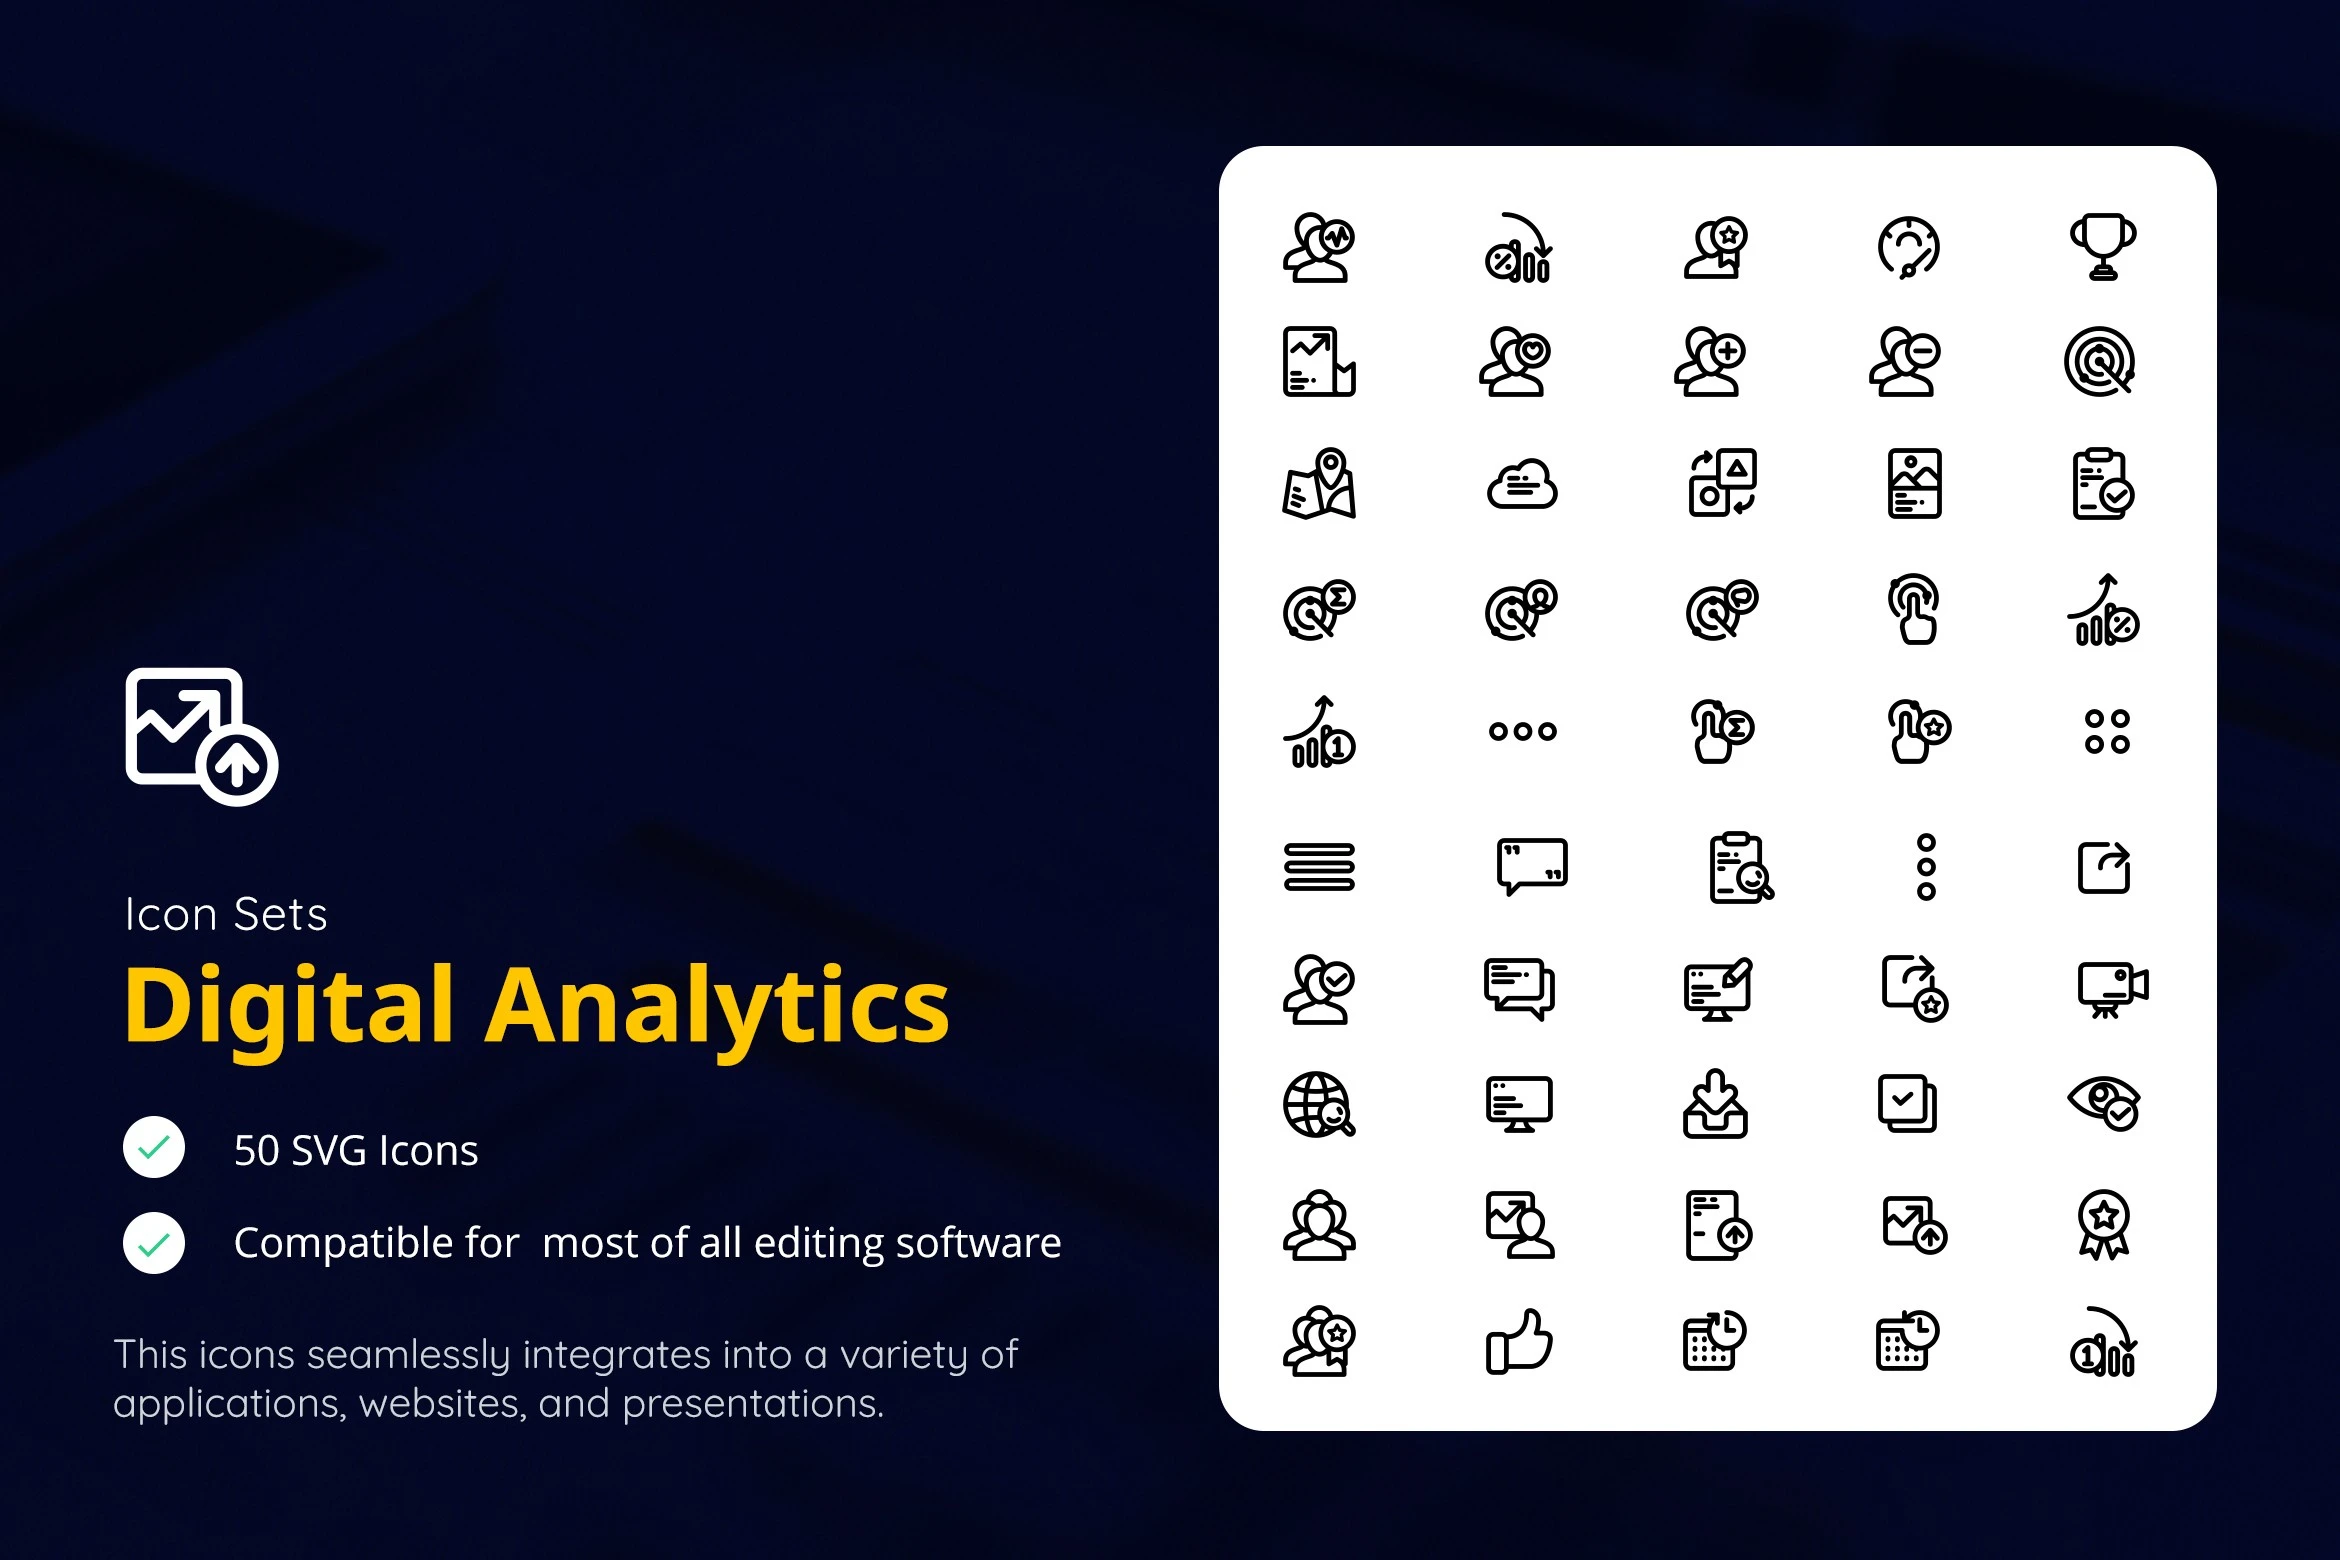
- 500+ Icon SVG
- All graphics resizable and editable
- Used and recommended free web fonts
- Based on Master Slides
- 16:9 Wide Screen Ratio
- Picture Placeholder
- Easily Editable!
Why Choose VizualReport?
VizualReport isn't just a presentation template; it's your key to conveying data-driven insights with precision and impact. Whether you're reporting to clients, presenting to stakeholders, or analyzing data for strategic decisions, VizualReport empowers you to communicate your insights effectively.
Don't settle for generic data reports when you can elevate your data presentations with VizualReport. Make every report a powerful narrative and drive informed decision-making. Get started with VizualReport today and watch your data insights shine!
